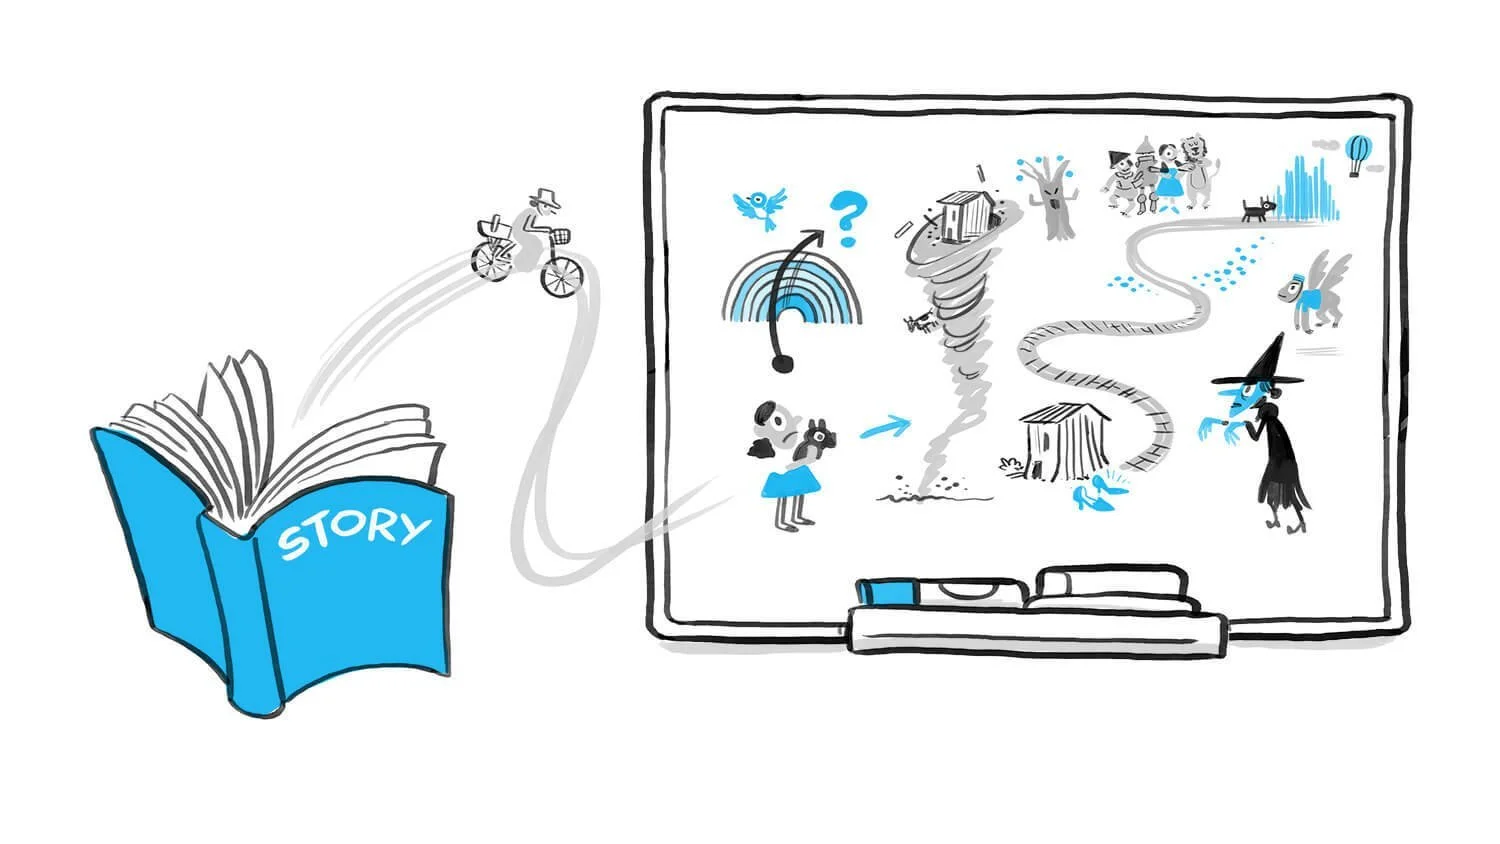
Once upon a time, in a world brimming with words and numbers, there emerged a powerful form of communication that transcended the boundaries of language - visual storytelling. Our story begins in the heart of a bustling city, where images and visuals narrate tales more compelling than words ever could.
Join us on a journey of discovery to uncover the workings of visual storytelling and its ability to present statistics and data in a whole new light.
The Rising Dominance of Visual Media
In an age where digital media reigns supreme, visual storytelling has become an integral part of our daily lives. The statistics are telling: according to a report by the Social Science Research Network, 65% of people are visual learners, indicating a natural inclination towards visual content. Furthermore, research by John Medina for his book “Brain Rules” reveals that when information is paired with a relevant image, people retain 65% of the information three days later, compared to only 10% retention with text alone.
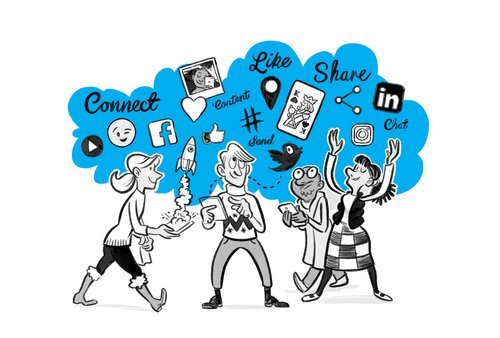
The Impact of Visuals on Social Media Engagement
Social media platforms, the modern-day canvases for storytellers, show a significant preference for visuals. A study by BuzzSumo, analyzing over 100 million articles, found that articles with an image once every 75-100 words received double the social media shares as articles with fewer images. Additionally, Twitter reports that tweets with images receive 150% more retweets than those without.
The Power of Video in Storytelling
The realm of video storytelling is another testament to the power of visuals. According to a HubSpot survey, 96% of marketers agree that videos have helped increase user understanding of their product or service. Insivia's findings reinforce this, stating that viewers retain 95% of a message when they watch it in a video, compared to 10% when reading it in text.
Infographics: The Confluence of Data and Design
Infographics have emerged as a potent tool in visual storytelling, blending data with design. A study by the Wharton School of Business found that presentations with visual aids were 43% more persuasive than those without. Eye-tracking studies by Nielsen Norman Group also show that readers pay close attention to information-carrying images, indicating the effectiveness of infographics in communication.
The Future of Visual Storytelling
As we look towards the future, emerging technologies like augmented reality (AR) and virtual reality (VR) are set to revolutionize visual storytelling. Goldman Sachs predicts that the VR and AR market in entertainment will reach $3.2 billion by 2025. This advancement will open new dimensions in storytelling, allowing audiences to immerse themselves in stories like never before.
The data speaks volumes: visual storytelling is not just an art; it's a highly effective means of communication in our increasingly visual world. As storytellers, embracing this form of narrative is not just about keeping up with the times; it's about connecting with audiences in the most profound and impactful way possible. In the end, just like the vivid streets of our story's beginning, the world of visual storytelling is a tapestry of endless possibilities, waiting to be explored.
At We Are Cognitive, we guide clients through the tangled streets of visual storytelling, and create explainer videos that capture your vision, share your message and engage your audience. We’re here to help; contact us today if you have any questions about visual storytelling or want to discuss how your project could work as an explainer video!


By combining simplicity, creativity, and visual storytelling, whiteboard animation offers numerous benefits that can help companies improve their communication strategies. In this blog post, we will explore some of the key advantages that whiteboard animation brings to the table.